All of the work that we have done in this course has focused on the Diary of James Merrill Linn. During our time together this semester, aside from just learning the skills and tools of digital humanities research, we also developed a working knowledge of the Burnside Expedition, and the Civil War as a whole. As a final project, I wanted to determine if our new historical knowledge was based on reliable evidence.
Was James Merrill Linn a reliable, factual storyteller in the entries in his diary?
To answer this question, I decided to find another reputable source of information about events of the Burnside Expedition and compare the versions of events written in that source with the versions told by Linn. In making these comparisons, I also hoped to learn more about what can be gained from looking at historical events from multiple perspectives. I chose to compare Linn’s diary against the Burnside biography linked on our WordPress site because I believed that it could provide an objective, ‘zoomed out’ perspective on the events I wanted to examine. I also chose to limit the scope of this project to the events leading up to and during the battle of South Mills.
 The first step in the process was to go through the two texts and pull out lines where both authors were writing about the same event. I viewed the two texts side-by-side, and copied over quotes of the similar areas into an organizational text document to begin a list of the events that I wanted to study more closely.
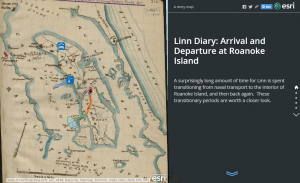
 Though the main essence of this project is text based, I still wanted to present the results as a story; the story of the Battle of South Mills as told from two separate perspectives. Out of all the visualization tools we worked with throughout the semester, I liked ArcGIS the most for storytelling, so I chose to use that to display my findings. However, instead of trying to show the similarities and differences on the map, I would use it to draw the viewer’s attention to certain locations of interest, and explain the findings of the project using popups and later the map journal sidebar.
Once I knew I wanted to mark each event on the map, the next question to  answer was ‘how?’ I determined that by using icons available in the map notes feature of ArcGIS, I could create nodes on the map that had a visual relation to the event that it represented. I feel that this choice of visual representation helped to keep visual clutter down to a minimum, as the icon was all that was needed to represent each point of interest in the project.
As for the maps I selected, the map of the Battle of South Mills was an obvious choice. It allowed me to place mid-battle nodes in proper places relative to each other and to the bigger overall scale of the battle. The pre-battle events were not nearly as location-specific, and so a less detailed map of a larger area was needed. In this case, the other map I chose for those elements was the North Carolina east coast map.
While I was analyzing the differences between the two writings at each event, I was coming up with different conclusions at each one. I realized that this was something I also wanted to convey to any viewers of the project, so I decided to include these conclusions along with the explanation of the interesting comparisons in the sidebar slides of the map journal publication.
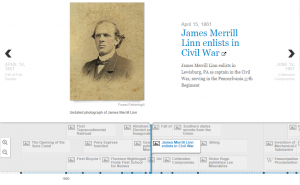
 At each slide of the published map journal, I decided to have the pop-up caption for the current node automatically open. These pop-ups all contain quotations from the original text which are very helpful for understanding the points being made in each slide of the sidebar. These automatic pop-ups are also useful during the Battle of South Mills to delineate which node out of the small cluster iscurrently active and being discussed.
After finishing this project, I’m fairly confident that I managed to answer my initial question. After cross-examination of both works of writing, I’m willing to say that Linn’s diary is accurate enough for us to gather reliable information about the Civil War and the Burnside Expedition from it. There were differences between the two versions of the story, but most of those are able to be explained simply by the difference in point of view. There were even a number of occasions where the Linn Diary went into more detail about an event than Burnside’s biography did, leading me to believe that Linn intended for his writings to be a reference for his actions in the Civil War.
In addition, I learned how important it is to check multiple references and points of view when analyzing a particular historical event. By combining the information recorded in the two writings that I studied, I was able to form a more complete picture of the battle of South Mills than either one could have given me individually. Every source seems to be likely to include some bit of data that all other references missed, and each bit can be added to the story like a puzzle piece, bringing you closer to fully understanding the event.
Overall, I thought that mapping using ArcGIS was the most effective of the methods we used in class for this project. Although it didn’t help me to formulate or organize my thoughts about my research question, it did provide me with a way to easily share my results with others.
Works Cited
Linn, James Merrill. Diary. April 17-19 1862. MS. Bucknell University Archives and Special Collections, Lewisburg, PA.
Ibrahim, Mohamed. Rowboat Map Icon. clker.com Retrieved 3 Dec. 2014
Woodbury, Augustus. “Major General Ambrose E. Burnside and the Ninth…” S.S. Rider & Brother, 1867. As retrieved from course WordPress Site.


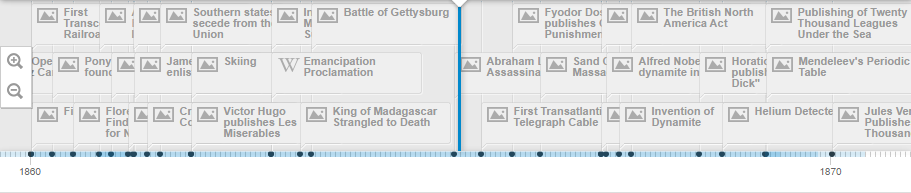
 the time when Linn was writing his diary. The creation and study of our completed timeline made me realize a few things. For example, it’s very easy to get wrapped up in a particular set of events. As a result, it can be difficult to recognize, or pay significant mind to, larger events going on around the same time. When reading Linn’s diary, I found myself forgetting that he was writing about events in a small corner of the Civil War. Opening up the scale and comparing his story to the rest of history really put his story into perspective. The scale of a historical graphic really depends on how detailed you make it, represented well by the annals from the 700s in Grafton’s essay.