http://bit.ly/1w0gpkm
For the Final Project, I chose to look into the 19 slaves Linn encountered on February 2, 1862. In his diary, Linn said that nothing happened except for a small boat with 19 slaves escaped from above Roanoke Island. This pique my interest since slavery abolition is the primary objective of the Union but Linn seems to be unfazed by the sight of 19 escaped slaves. This brought me to my question “how did the Civil War battles affect slavery?” I thought understanding the slaves’ origin, destination, and escape path would help us understand better about their lives hence giving us a better idea of the life of a slave during the Civil War. Depending on the path the slaves took, different difficulties arises. To map their escape, there is no better tool than GIS. With GIS, I can illustrate multiple layers of informations associated with the escape.
When I started this project, I did not have much information about the 19 slaves. Linn only mention them once in the diary. All I know was that there were 19 slaves including 5 women and a baby and they came from above Roanoke Island. Without actual information regarding the slaves, I was unable to present this in a story format with GIS. This was the biggest struggle I had during this project. Without any information regarding the time and date, I cannot present this in a timely manner. To figure out their path, I have to find their origin and their destination first.


For the origin, I used a layer of the concentration of slaves and the battles fought before February 2, 1862. To come to the Cossack on a small boat, the slaves have to came from a place relatively close to Roanoke Island. There were 19 slaves so they must have all escaped together from a place of high concentration of slaves. Their escape itself is a clue that their origin must have been affected by the war for them to have to opportunity to escape. Using GIS, I can see that Norfolk has a high concentration of slaves and has 2 battles fought near it. After doing some reserching, I learned that during the Civil War, the Confederates used slaves to build their forts. With that, I concluded that the slaves must have came from Norfolk. While working on the forts, the slaves saw the opportunity to escape.

Professor Jakacki introduced me to the Underground Railroad leading me to find the slaves’ destination. Even before the Civil War, the Underground Railroad has helped freeing slaves in America. Using the Underground Railroad map layer, I could see the directions that the slaves were going in order to attain their freedom. Then, I created a map note for the possible directions that slaves could escape to during the Civil War. To understand the difficulties of each directions, I created a map note for the distance between Roanoke Island and the closest point for each direction. With this, I was able to see the difficulty of each direction in term of distance in kilometer and in days it would take to walk that distance. The slaves had limited resources. They most likely did not have any mode of transportation to travel far so they were trying to get to the North, the direction with the shortest distance. Using the Underground Railroad map layer, I found Wilmington to be the closest Underground Railroad site to where they encounter Linn and his regimen. With this, I can conclude that the slaves were going to Wilmington in order to go to the North.

With both the destination and the origin, I mapped out the different possible paths the slaves took in order to get to Linn’s location. After their escape, to get to Linn’s location, the slaves must have found a small boat first. If the shore is where they got the boat, they must choose the safest path possible. With 5 women and a baby, they cannot run so they must avoid being seen. They must also avoid conventional roads. They must go through the woods or swamps to avoid getting caught. Using the Terrain map, I can see the swamps between Norfolk and the Shore. Then I created a map note for the those swamps. There are 2 swamps that connect Norfolk and the shore so that must be a possible safe path for the slaves. The second path I found after adding the canals layer to the map. There is a canal that goes from Norfolk to the ocean. This canal goes through a swamp so it might have been safe enough for the slaves to use provided that the canal is big enough for the slaves to use. They must have stole a small boat from Norfolk and travelled down the canal to the Ocean and eventually to the Cossack.
With the help of GIS, I was able to deduce and map the escape path for the slaves with very little information and some research. The 19 slaves have encountered many difficulties in order to attain their freedom. Using GIS, I was able to see and understand the struggles that many slaves faced in their escape. I can see how the Civil War itself affect slavery. War is a double edge sword. Although slavery is the subject of the Civil War, the war itself caused the slaves to be under heavy surveillance. However, we can see that because of the battles, many slaves have to work on the forts providing them an opportunity to escape and gain freedom. This project has helped me to understand the state of slavery due to the Civil War.
Work Cited:
Linn, James Merrill. Diary. [February 2] 1862. MS. Bucknell University Archives and Special Collections, Lewisburg, PA.
“Underground Railroad.” History Net Where History Comes Alive World US History Online RSS. N.p., n.d. Web. 16 Dec. 2014.
Rasmussen, William M. S., and Lora M. Robins. “How Did Slaves Escape?” Virginia Historical Societys Blog. Virginia Historical Society, 20 Oct. 2010. Web. 16 Dec. 2014.
“Underground Railroad Sites.” PBS. PBS, n.d. Web. 16 Dec. 2014.
United States. National Park Service. “List of Sites for the Underground Railroad Travel Itinerary.” National Parks Service. U.S. Department of the Interior, n.d. Web. 16 Dec. 2014.

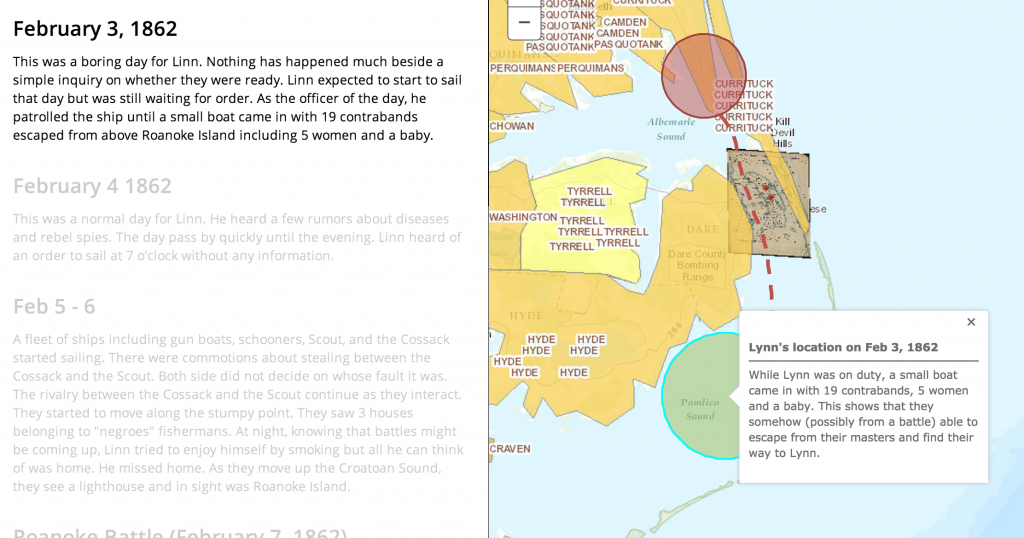 “Evidence about the world depends on the perspective of the observer” (19). In the diary, Linn mentioned that the gun boats went between Tyrrell Shore and Roanoke Island. As we can clearly see, Tyrrell is the slave concentration area which is far from Roanoke Island. Without the help of GIS, we would not have question Linn’s directional sense. This ,however, can also means that the maps they had back then was not accurate. The answer to this is not important but what important is the question itself. Without GIS, we would never have come up with this hypothesis and therefore another piece of information.


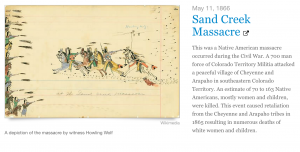 This is an example of many events that are significant but not directly correlated with the Civil War. Since time is nonlinear (20), the connection between events in a timeline is not easy to grasp. Grafton stated in his article that “the line can be everywhere because it is so flexible and its configurations so diverse” (13). We don’t usually associate the Indian War with the 1860s since the Civil War was considered more significant. Seeing the orders of events of the Civil War and this massacre, we can make the connection between the Civil War and the Indian Wars.
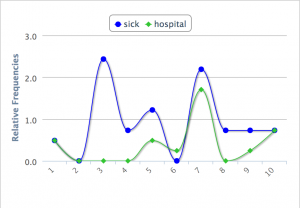
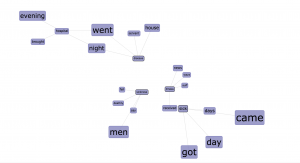 s brings me to a new question: What words are connected with these? Using Links, I tried to see how they intertwine. However, seeing that they never directly intertwine, I decided to use different variations of “sick”. I used “sickness”, “disease”, and “illness”. Finally, with “disease”, I was able to find a direct connection with “hospital”.