Throughout history, the ability to get chronology correct has been vital. Grafton states, “For Christians, getting chronology right was the key to many practical manners…” (1). It is after using Timemapper that I can truly appreciate how writing needs to be represented in a form that can easily depict change over time. What is Timemapper one may ask? Timemapper is an online tool that is used to piece together timelines in which one can choose the duration. For example, our class chose the 1860’s as an ideal time to create a timeline, thus resulting in the emergence of events I never knew happened in that time period.
What Timemapper does better than just a regular time line is that it puts a visualization of the event into the viewer’s head. Picturing time through just words on paper is a very difficult task. As Grafton points out on page 10, “…we typically see them as only distillations of complex historical narratives and ideas.” But, through an interactive timeline with pictures, we are able to comprehend events at a faster rate than if we were just looking at words on paper. For example, we can look deeper into an issue such as the publishing of Twenty Thousand Leagues Under The Sea while at the same time; see the impact of Alice in Wonderland in the 1860’s society. Timemapper helps give the viewer a short summary of the event and put a picture into that viewer’s head.

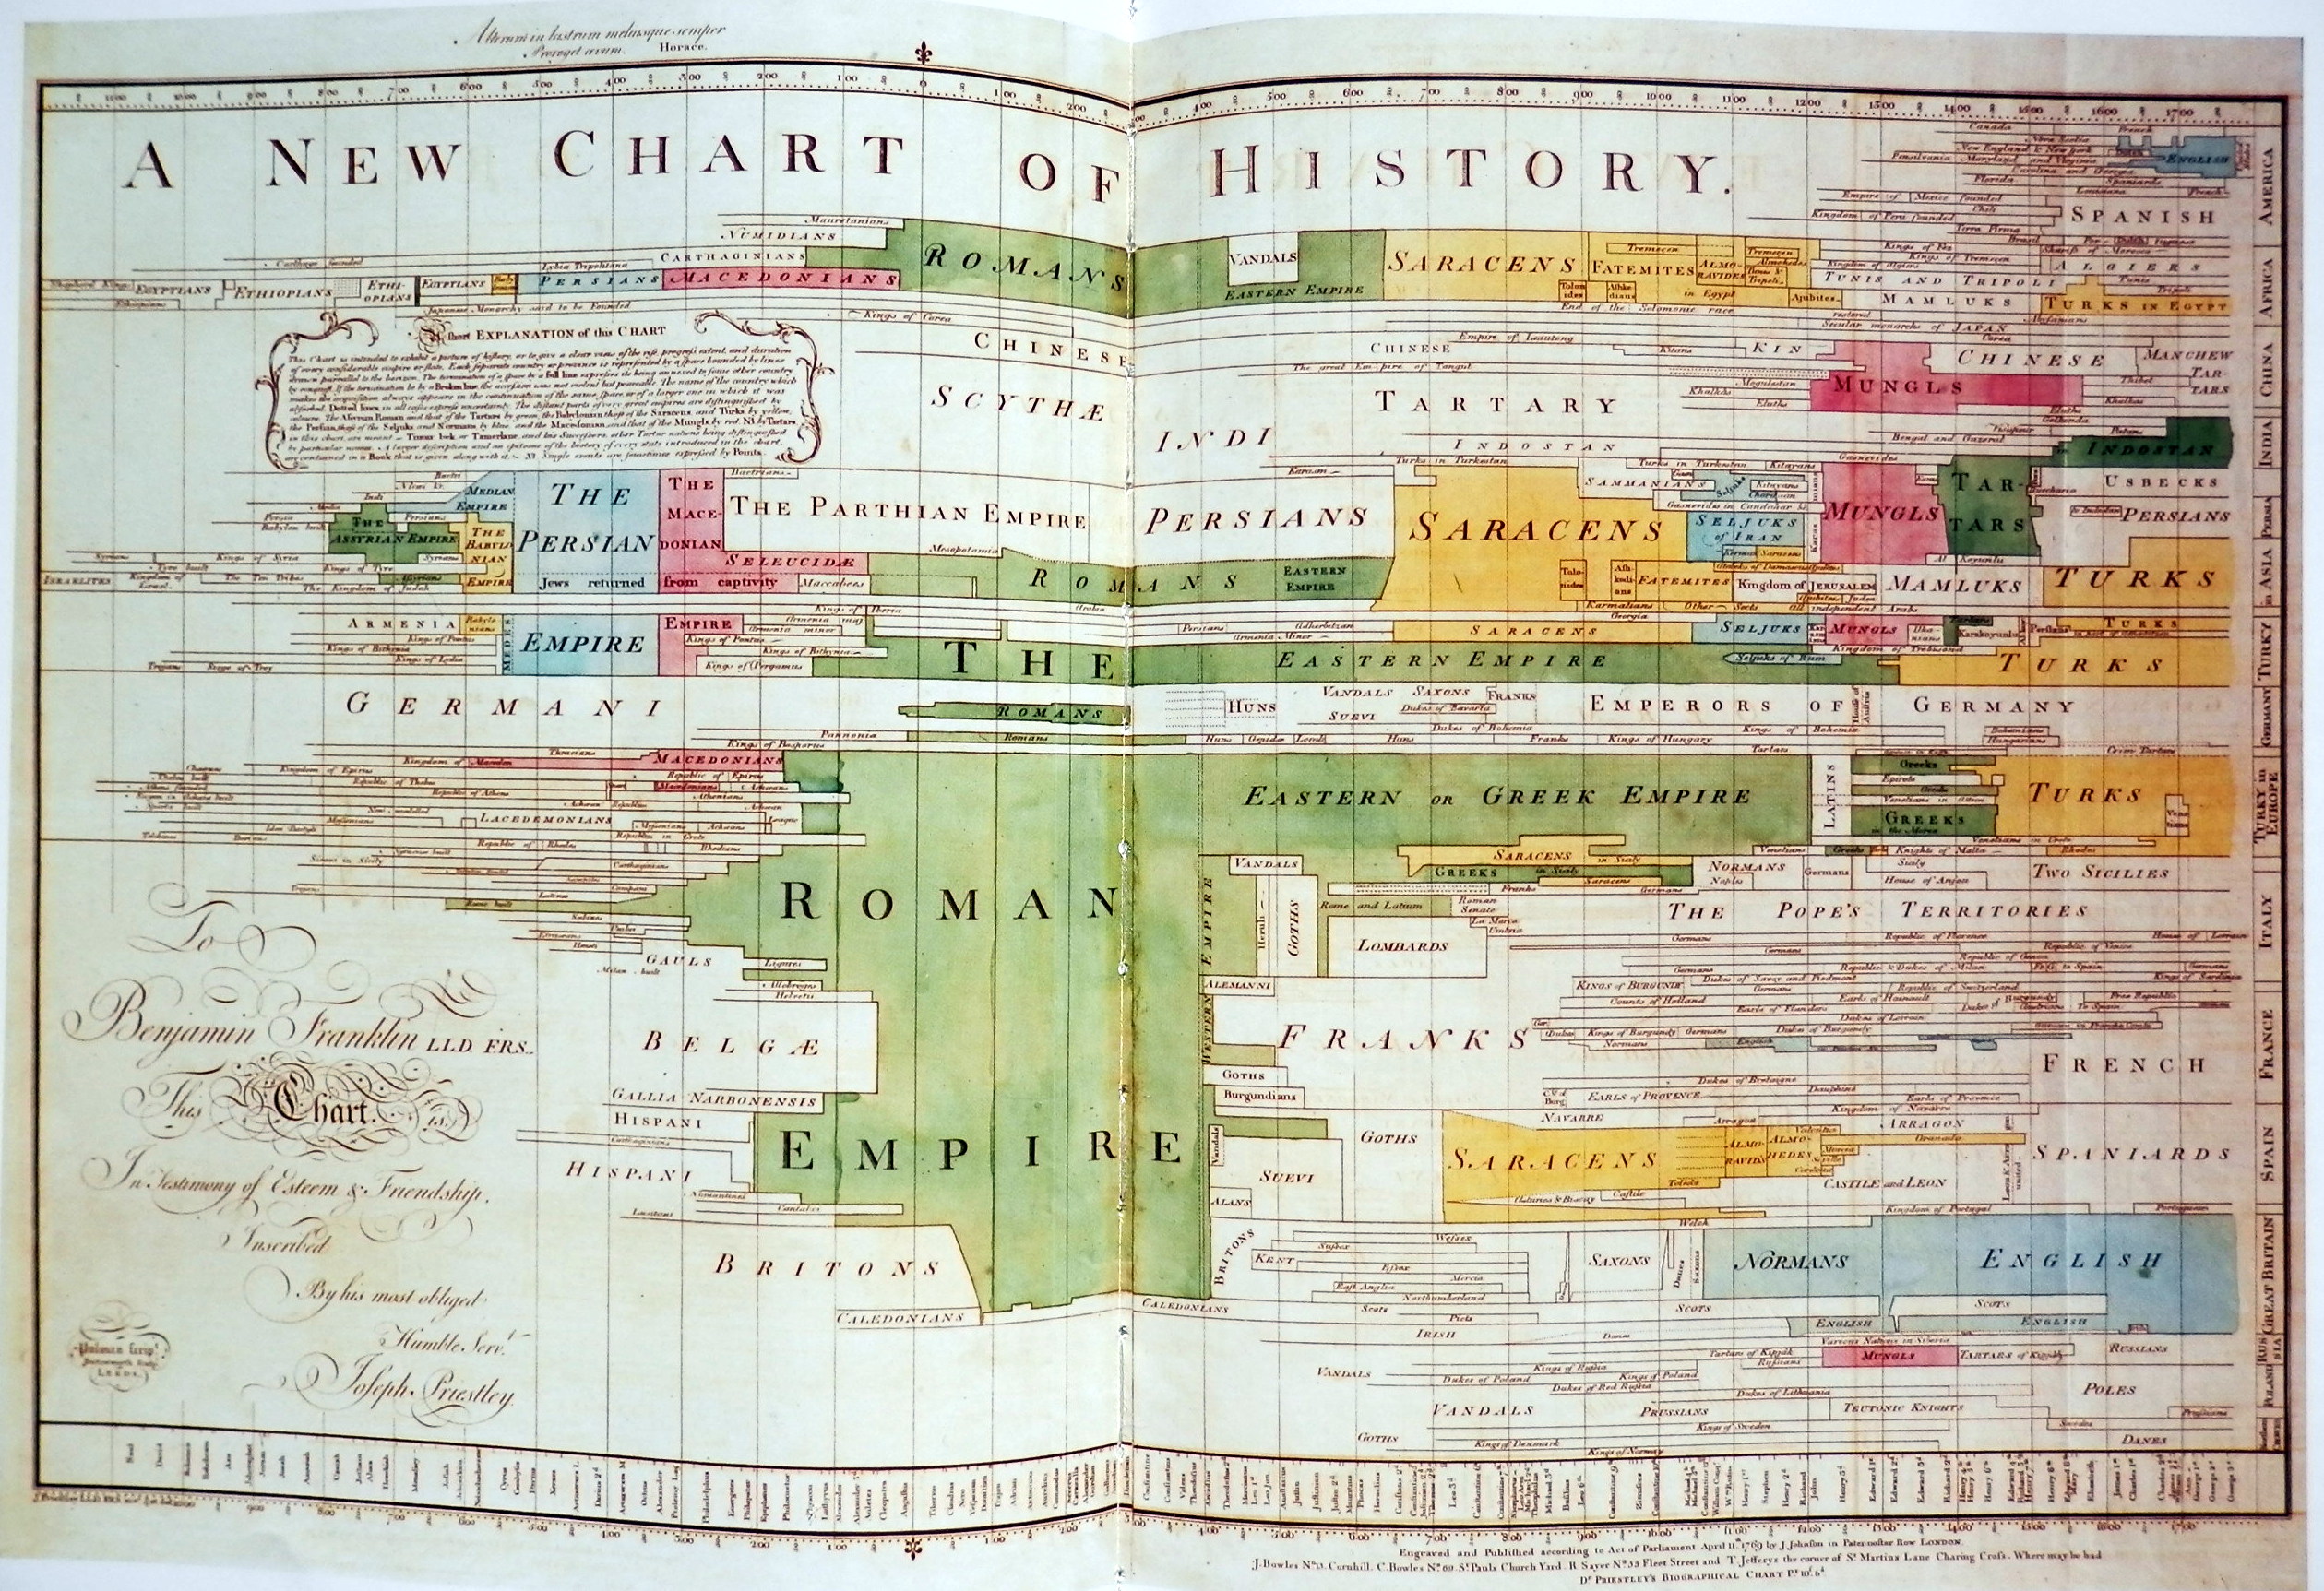
In his essay, Grafton also talks about Priestley’s invention, the Chart of Biography. “Among the most important events of this period was the publication in 1765 of the Chart of Biography…” (Grafton, p. 19). This chart, revolutionary for its time, revealed the dates of birth and death of historical figures. In conclusion to this chart, Priestley and other theorists firmly believed that a linear timeline does not in fact help the user comprehend the information. Priestley’s chart was the first of its time and set the benchmark for timelines leading all the way up until today.