Categories
Blog #3

Chronology:TimeMapper

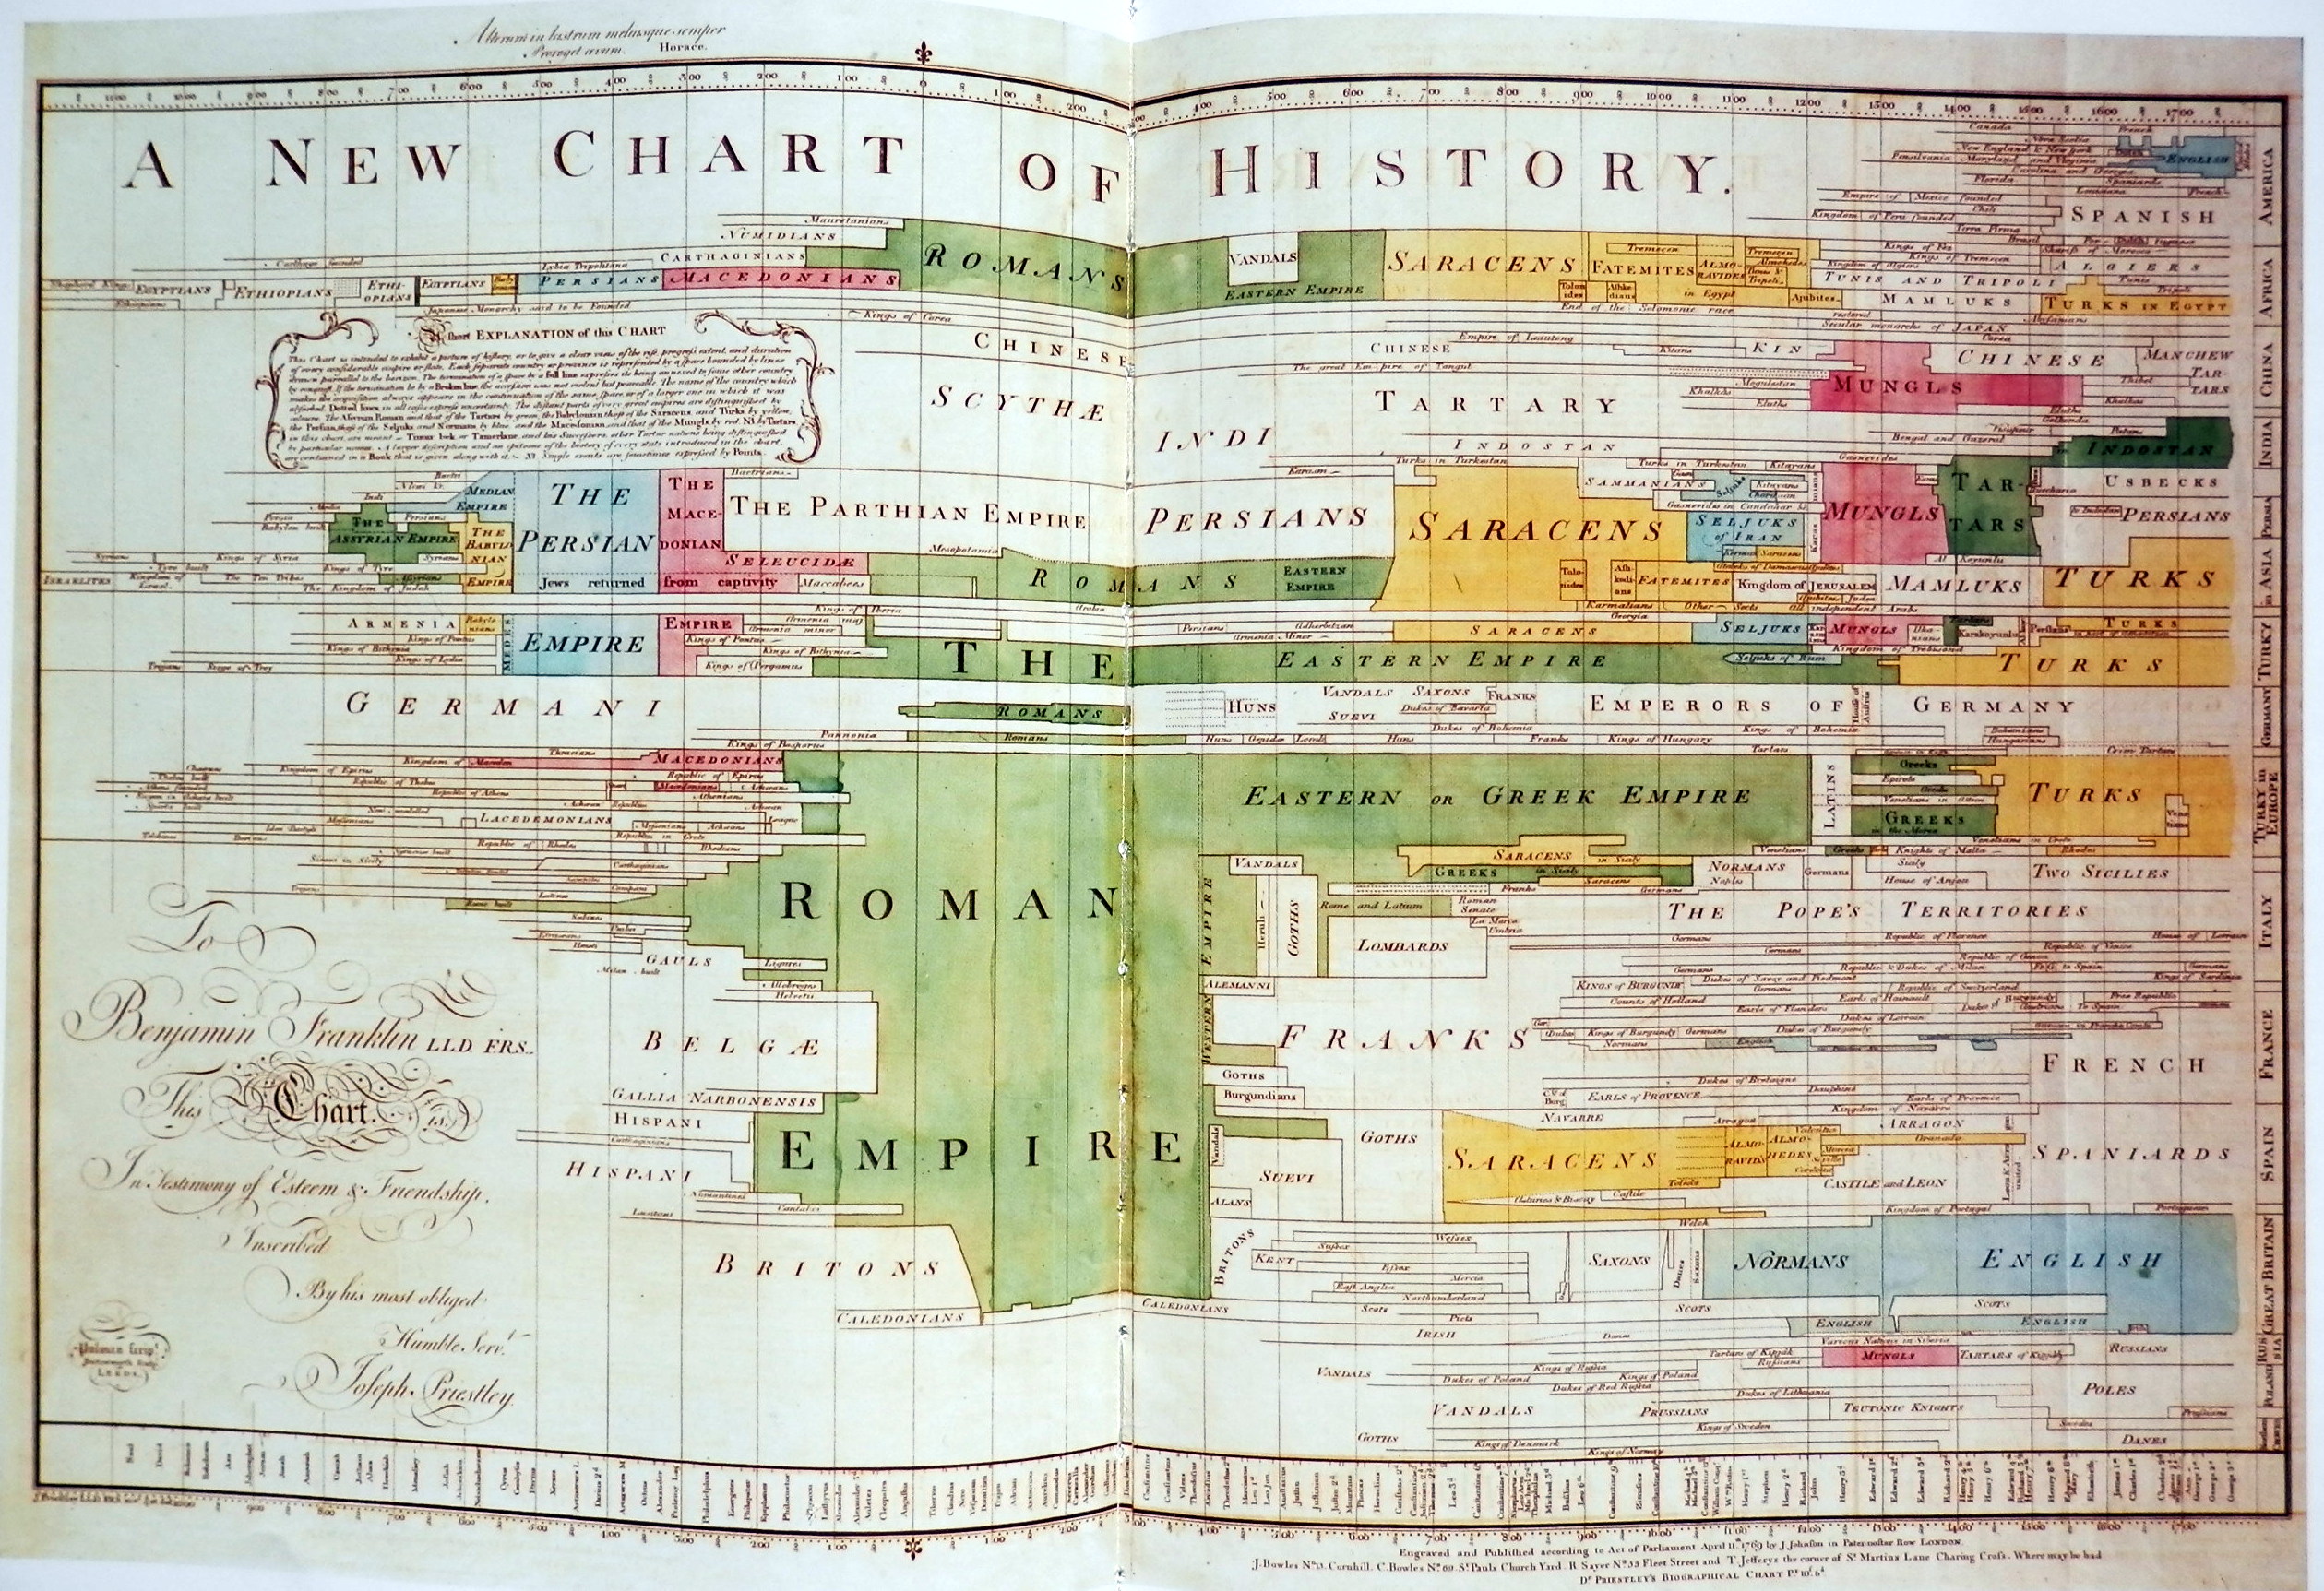
TimeMapper is a great tool for organizing and representing events. Through TimeMapper, we can organize informations into a timeline of significant events. We often think of time as a linear line, however, time is nonlinear (Grafton, 20). Historical events usually don’t start and end in a linear fashion. There are many events happening at the same time with different causes and ends. Using timelines, we can illustrate time as an order of events.

Screen Shot 2014-10-05 at 10.50.28 PM

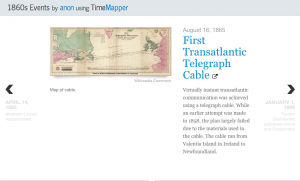
Above is our TimeMapper of the 1860s. The key idea of chronographic is not to design “more complex visual schemes” but rather to “simplify” it (19).  By treating time as a linear line, we can see the connections between different events in an era. For example, we often relate the 1860s to the civil war but there were a lot more happening in the 1860s than the Civil War. The Civil War took about 4 years from 1861 to 1865. There were also the American-Indian Wars and the inventions of telegraph and dynamite which we are oblivious to. Using TimeMapper, we can understand a lot more about the 1860s. Like Linn, we are confined to a certain amount of informations which we can only experience personally. In the diary, Linn was oblivious to the world around him. He was only concern with what he was personally experiencing. With the help of timelines, we can study history more chronologically correct.

Screen Shot 2014-10-05 at 11.27.32 PM
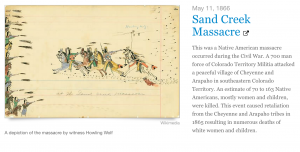
This is an example of many events that are significant but not directly correlated with the Civil War. Since time is nonlinear (20), the connection between events in a timeline is not easy to grasp. Grafton stated in his article that “the line can be everywhere because it is so flexible and its configurations so diverse” (13). We don’t usually associate the Indian War with the 1860s since the Civil War was considered more significant. Seeing the orders of events of the Civil War and this massacre, we can make the connection between the Civil War and the Indian Wars.

Categories
Blog #3

Skiing Invented During the Civil War

Personally, I think the relationship between ideas and modes of representation is very confusing. But visual modes of representation do help to clarify events in time.

For example, in class we made timelines of our lives and then our days. It was really interesting to see what you remember, but also helps to have it all mapped out on a timeline to clearly see the chronology of important events in time. “For Christians, getting chronology right was the key to many practical matters such as knowing when to celebrate Easter and weighty ones such a knowing when the Apocalypse was nigh.” (Grafton, pg 11) It’s not just important for ordinary people to use chronology to remember information, it can also help with dating significant events in time. However, in historical times there was no exact chronological order of every event that occurred. So people had to use visual modes of representation to get an accurate timeline of events. “Still, experiments continued. Some were graphic, like the effort to lay out all the main historical events on a calendar that stretched not from the Creation or Abraham to the present but from January 1 to December 31, with important events in the past stacked up day by day, through the year.” (Grafton, pg 17).Screen shot 2014-10-05 at 10.46.02 PM

It’s interesting to think about how time played out for Linn in his diary. It was also fascinating to see how really significant events in history occurred in the same years as Linn’s diary, so while the Civil War was going on. For example, who knew that the first transantlantic telegraph cable was used during the same decade as the Civil War was taking place. However, this would not have been as simple if we did not have the technology we possess today. It definitely made studying and comparing historical events easier and more accessible to the public. Although it is very eminent, we must remember that “Though technology plays an important role in our story, it doesn’t drive it.” (page 15) It was especially interesting that Linn didScreen shot 2014-10-05 at 10.45.40 PM 
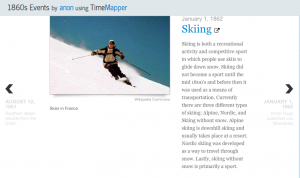
not mention any important historical events that occurred outside his life in the Civil War. For example, skiing was invented in the same winter when Linn was writing in his diary. Although he did not have the Internet or any technology that would have allowed him to gain access quickly, I assume that word of a new sport like skiing would have been spread about in the United States as well, but there was no mention of skiing or any important event that occurred outside of his immediate realm.

Categories
Blog #3

TimeMapper and Chronology of events

TimeMapper is a tool that helps to organize historical figures and events in a chronological order. After you fill in the correct info for your specific event and submit the information, it is then documented in a google doc and is placed into the timeline. In our TimeMapper we created a database of historical events that were happening around the same time that Linn was writing his diary to see what events could relate to James Merrill Linn in the winter of 1862.

Chronology of events is important because if it wasn’t in the correct order the context wouldn’t make sense to the reader and they would have trouble following what was going on. Chronology illustrates the sequence of historical events.

Graphical representation clarifies historical events, because I believe it makes the information more clear and interesting to look at as opposed to just words. It shows the chronological order of events in an organized and easy to follow format.

TimeMapper doesn’t give any representation of the ideas, similarities and connections between different events except for time. In Linn’s narrative the timeline was very helpful in showing the chronological timeframe events were occurring in, but not the connections between the different events.


Screen shot 2014-10-05 at 10.42.08 PM
Battle of Gettysburg

When I was reading Linn’s diary, I was sometimes confused with the specific events he was talking about during that time period. However, when I saw the timeline comparing his story to the rest of the history, I was able to better understand the context of certain events and have a better perspective of why certain things were occurring. TimeMapper helped me to see where Linn’s diary entries were in relation to history around that time period.


Screen shot 2014-10-05 at 10.12.05 PM
King of Madagascar Strangled to Death

In Grafton’s essay he states how he believes that graphic representation is among the most important tools for organizing information. Grafton states that one of the reasons for the gap in our historical and theoretical understanding of timelines is that people generally consider chronology as a kind of study. He says people see them only as distillations of complex historical narratives and ideas. Chronologies work and that’s pretty much enough for the average reader. But this is a false belief. For example, from the classical period to the renaissance in Europe, chronology was held at a status higher than the study of history itself.After creating a timeline called the Chart of Biography, Priestley reveals that “historical narrative is not linear”. He claimed that a linear timeline does not represent the connections between events and historical figures in a precise way.

Categories
Blog #3

Thoughts on TimeMapper: A Time of Progress

Chronology of events is something that has always been crucial to the understanding of any sequence. Not only does to show us what the order of events was, it provides context. Throughout my time in school, history classes from elementary school to college have used timelines as a teaching tool. Although I have never put a lot of thought in to it, knowing the order of events is crucial to understanding. Grafton says that a timeline must be “possessing a structure” or show an “order of meaning,” (Grafton 11). For me, this is the same as the context that they provide for me. It isn’t completely about finding when they happened, but more about how they fit together in time and how they show a change or some trend. He says that in his article when he says, “the form of a timeline is….. emphazing overarching patterns and the big story,” (Grafton 20). It shows what happened in the time around an event, and knowing that can help you interpret each event differently, as well as the time.

Although i love timelines, I think some of the visuals on TimeMapper are tough to deal with and that the website could be switched around. It is hard to see all the events spread out, which would make it easier to jump to stronger connections. But, after analyzing our map and timeline, i did see a pattern. A vast majority of the events that we mapped were from two distinct categories. For me i see a broad spectrum of events, but most of them shows change and i want for voices to be heard.

Screen Shot 2014-10-05 at 9.54.24 PM
A cluster of writings and inventions in Europe, which show the want for people’s voices to be heard
Screen Shot 2014-10-05 at 9.54.16 PM
the description for the death of the king


On the below, you see the description of the murder of the King of Madagascar,, which is one of many change oriented events that were on our time mapper. Other events include the murder of the King, Unification of Italy, and the Civil War. These events show a desire for change in the way the world is, with the world in a time of progress. A common theme in this time was the desire for their words to be heard, whether its the publishing of a book, or a civil war about civil rights. It is a time for change, and i think our time mapper shows that.

Categories
Blog #3

Blog Post 3: The History of Chronology

Throughout history, the ability to get chronology correct has been vital. Grafton states, “For Christians, getting chronology right was the key to many practical manners…” (1). It is after using Timemapper that I can truly appreciate how writing needs to be represented in a form that can easily depict change over time. What is Timemapper one may ask? Timemapper is an online tool that is used to piece together timelines in which one can choose the duration. For example, our class chose the 1860’s as an ideal time to create a timeline, thus resulting in the emergence of events I never knew happened in that time period.

What Timemapper does better than just a regular time line is that it puts a visualization of the event into the viewer’s head. Picturing time through just words on paper is a very difficult task. As Grafton points out on page 10, “…we typically see them as only distillations of complex historical narratives and ideas.” But, through an interactive timeline with pictures, we are able to comprehend events at a faster rate than if we were just looking at words on paper. For example, we can look deeper into an issue such as the publishing of Twenty Thousand Leagues Under The Sea while at the same time; see the impact of Alice in Wonderland in the 1860’s society. Timemapper helps give the viewer a short summary of the event and put a picture into that viewer’s head.

Screen Shot 2014-10-05 at 9.42.28 PM
Timemapper summarizing Twenty Thousand Leagues Under the Sea

In his essay, Grafton also talks about Priestley’s invention, the Chart of Biography. “Among the most important events of this period was the publication in 1765 of the Chart of Biography…” (Grafton, p. 19). This chart, revolutionary for its time, revealed the dates of birth and death of historical figures. In conclusion to this chart, Priestley and other theorists firmly believed that a linear timeline does not in fact help the user comprehend the information. Priestley’s chart was the first of its time and set the benchmark for timelines leading all the way up until today.

1765 version of The Chart of Biography