Linear Expression of History and TimeMapper

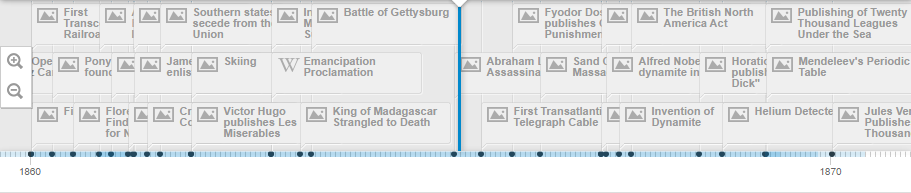
Representing complex ideas in a graphical form is such a difficult pursuit that perhaps there can be no perfect finished product, as complex abstract ideas cannot be wholly expressed in visual terms. Grafton examines one of the  the oldest and most common ways in which we visualize history, the line. The line as a metaphor is so ubiquitous it appears to be inseparable from our understanding of the passage of time, thus its universality in chronology and graphical representations of history. The line, however important when dealing with the order of things, presents an account of history in a one-dimensional manner. History, as Grafton notes, is filled with relationships, details and digressions impossible to translate into a linear format. Graphical representation gives context to fact, establishes relationships and introduces new information- such as geography- that one might initially overlook. Above providing additional  information, graphical representations allows one to easily digest diverse forms of data. Linn’s narrative is closely effected by the events hundreds of miles from his physical location, events like outcomes of distant battles and politics in both Washington and Richmond. The responsiveness of very distant events and the personal life of a single civil war tie in closely with the developments of the 1860s. A message from across the atlantic ocean, thousands of miles from Linn’s position could alter is narrative within a matter of days or hours. One of the major events of the 1860s was the laying of the first transatlantic telegraph cable

adfwf

One of the most important events in the 1860s with an influence on Linn’s life.

. Immense changes  were underway during the 1860s that are very evident in Linn’s day-to-day narrative. In fact, the first four events on the TimeMapper follow a common theme; the creation of the first intercontinental railroad, the founding of the Pony Express, the opening of the Suez Canal and the invention of the bicycle.

scnsht

Here we see the first four events in the Timemapper deal with developments in travel and communication.

The world was becoming smaller, information, people and goods could be transported at an unprecedented rate. Countries and continents were interconnected in ways never before seen in history. Thus we immediately see the interweave of the events from the TimeMapper timeline and Linn’s narrative.

Downfalls of TimeMapper

Throughout my past experiences, I always believed that timelines were very useful in terms of understanding history. For starters a good timeline is aesthically pleasing and they can provide a perspective of important events occurring throughout the world. For example, when I am learning about the Civil War I can take a look at a timeline and see what events are occurring in other areas and see if they are relevant as timelines allow for easy comparisons, patterns to be observed, and interpretations to be made. In the article, Rosenberg and Grafton put a lot of emphasize on lines as the means of representing time. This illustrates how simple but still useful timelines can be. One simple line can give “visions of past and future,” which illustrates the importance of chronology (Rosenberg, Grafton, 11). Chronology is significant in understanding history because events in the past, drive the future. Through studying time, historians can make assessments as to why certain events occurred and what spurred them on. It is important to note that although a timeline may appear as simply a line, the makers of timelines must be given a lot of credit. Timelines can be difficult to create as Rosenberg and Grafton point out, because the events must “be revealed as possessing a structure, an order of meaning, that they do not possess as mere sequence” (11). It is not enough to place events together, they should have a deeper meaning that can be analyzed.

Screen Shot 2014-10-04 at 8.23.30 PM

TimeMapper

Although I am a huge proponent of timelines, I do not find the TimeMapper that we made in this class very helpful. The timeline is very squished together which makes it difficult to search for connections among the events. Additionally, events related to history, sports, english, and miscellaneous events are all put together on the timeline. It would have been more helpful if we split up the events by category in order to make the events easier to analyze. The way I went about analyzing the connections and relevance among the events was by clicking each one and reading through the description given. By doing so, I was able to find some interesting connections. This timeline made it possible for me to discover that in the 1860’s the Suez Canal opened, the first bicycle was invented, the Pony Express was founded, and the first continental railroad was constructed. All of these four events are related to traveling and communication, which makes me wonder if there is a reason as to why they were invented around the same time, and if the makings of one or two inspired the others to be created. I would not be able to dig deeper into this connection if this timeline did not help me notice that they all began in the same period of time.

Screen Shot 2014-10-04 at 8.27.57 PM

Map

One aspect of the TimeMapper that I did think was useful was the map. The map had blue ticks of where each event took place, and by scrolling over the blue ticks, you could see which event occurred there. For example, through the map I can find out that the First Transcontinental Railroad Construction occurred in North America. I could then continue clicking through the blue ticks on North America to discover other important events that happened in the 1860’s. I think that it is important to not only analyze events by times, but also by location too.

Since James Merrill Linn only discuses events that are specifically related to hScreen Shot 2014-10-05 at 7.32.42 PMim, and not in the world around him this timeline serves as a useful tool to enlighten us of the global issues and accomplishments of Linn’s time. For example, through this timeline I was able to discover that in 1861 the Fall of Fort Sumter was the battle that began the Civil War. This is important because it gives background to Linn’s experiences during the Civil War, and we can literally see where his diary entries fit in. There are other events that are specifically relevant to Linn and the Civil War such as the secession of the Southern States. Through this timeline I learned of important events that occurred both prior and during the war that Linn failed to discuss or mention in his diary entries.

Blog III: Representing Time with Space

Representing historical events in a written form can be a difficult process.  Writing is a medium that, once created, is unchanging, so the information needs to be represented in some way that can still show change and time.  We do this by manipulating space.  Grafton pointed out in his writing that traditional clocks trace time as a circle, and even when we look at a digital clock, we translate the numbers that we see into a line of the time in a day.


The same process happens with the longer-scale time of history as well.  It’s difficult to understand history by simply interpreting words on a page, so we translate the words into events and visualize those in space.  Commonly, those events go on a timeline.  Timelines are good at showing proximity and distance between events, and revealing patterns over time.

In our Timemapper timeline, we constructed a database of historical events that surround 1860s Events - TimeMapper - Make Timelines and TimeMaps fast! - from the Open Knowledge Foundation Labs
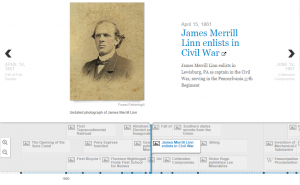
the time when Linn was writing his diary.  The creation and study of our completed timeline made me realize a few things.  For example, it’s very easy to get wrapped up in a particular set of events. As a result, it can be difficult to recognize, or pay significant mind to, larger events going on around the same time.  When reading Linn’s diary, I found myself forgetting that he was writing about events in a small corner of the Civil War.  Opening up the scale and comparing his story to the rest of history really put his story into perspective.  The scale of a historical graphic really depends on how detailed you make it, represented well by the annals from the 700s in Grafton’s essay.


Timemapper also revealed how independent history and different parts of the world can be.  While the Civil War was going on, life in the rest of the world went on as normal.  Even in many parts of the United States, major events happened that had nothing to do with the war.  This ties in with my previous observation, and helps to explain Linn’s writing.  Human history is a collection of the stories of individuals who move around, who make and lose connections.  It’s impossible to represent such a complicated system in a definitive, single-stream way.

1860s Events - TimeMapper - Make Timelines and TimeMaps fast! - from the Open Knowledge Foundation Labs (1)

The events of a decade

Blog Post #3 Prompt

“On Time”
Due Sunday 10/5 by 11pm
Thinking about how we represent history has been a question that has occupied us for millennia.  Why does chronology of events matter?  What can it show?  How can we represent history? How do we “draw time”?

In “Time and Print,” Grafton observes that “Teachers and theorists claimed, over and over again, that chronology and geography were the two eyes of history: sources of precise, unquestionable information, which introduced order to the apparent chaos of events” (Grafton, p. 17)  At the same time, the author points to Joseph Priestley, the 19th century scientist who believed that “historical narrative is not linear.” (20) So how do we reconcile linear and nonlinear time?

In the process of compiling your entries for the collective 1860s Timemapper and thinking about how time played out for Linn in his diary, how have you come to terms with the complex relationship between ideas and modes of representation?  How does graphical representation clarifiy historical events?  Where do we place Linn’s narrative within that representation? Where do the 1860s and Linn’s experience in winter 1862 fit together?

Write a 300-word blog post on this topic.  Include at least three points from Grafton’s essay in your entry and at least two illustrative screen shots from Timemapper that illustrate your argument. Give your post the category “Blog #3” and at least five tags that help you to explain your work.

In addition, choose one of your classmates’ posts and give them feedback in the Comment box. Your comment should be 50-75 words in length and respond to a specific argument that is made in the post. For example, your comment might identify a correlation between your own post and one you see in your classmate’s work; it might introduce to the post’s author a different reading of something they interpreted in the Grafton essay; or it might reflect upon ways in which you both consider Linn’s experience within a larger chronological landscape.

Mapping Operation War Diary – Bringing the Battlefields of Yesterday to Life | Operation War Diary

More and more frequently interesting new Digital Humanities projects are discussed in the media. This morning, Professor Faull sent me a link to this article. Here is a project called “Operation War Diary” that is using GIS mapping (with which we’ll be working later in the course) to assess how much the landscapes described in the war diaries have changed in the 100 years since they were written.” Look at the bottom of the article: see how the team researching this project ask readers to help them determine which might be the best approach to doing this type of work.

Mapping Operation War Diary – Bringing the Battlefields of Yesterday to Life | Operation War Diary.