On Monday, December 8 (last class) each student will present a 3-5 minute lightning talk about their final research project.
Your lightning talk should focus on work process, including discussion of data sources (maps, data layers, text), and plan for how data will be gathered/displayed/published with emphasis on tool chosen.
Your talk should be illustrated with slides (PowerPoint or Prezi) and should include
research question/hypothesis
2-3 slides w/ images of progress (e.g. close-up of tagging with problem or approach; map layers & data)
next steps in terms of evidence gathering and demonstrating that evidence in tool
In order to ensure that all students can present within the class period, please email your PowerPoint or Prezi link to me in advance. I will load them all on the computer before class so that transition between lightning talks is efficient and quick.
Here is what will happen in each class, important milestones, and plans for next Monday.
Monday, December 1
Final project workshop
abstract (150-200 words) due by 11pm
Wednesday, December 3
Final project workshop
Outline of expectations for lightening talk
Friday, December 5
Final project workshop
Expectation of working draft of artifact by end of Friday’s class.
Homework: Prepare for Monday’s lightning talk
Lightening talk consists of:
Short in-class presentation of final project (3-5 minutes long) that is an articulation of research question, reason why this tool was chosen, whether or not it achieved the sought for answer to research question, demonstration of its function/argument as distinct because of the tool/approach.
GIS, Geographic Information System, helped us visualize the life of James Merrill Linn and the Civil War by showing us the travel path he took. Throughout the class, we have been introduced to different techniques which people have used to decode a text and learned to derive information through various means: TEI, TimeMapper, Voyant Tools, Transcribing. This tool is the most effective so far. It allows us to see many layers of information letting us to obtain a lot more informations. We are able to see it in geographic form and displaying informations including time and context.
Bodenhamer says “We recognize our representations of space as value-laden guides to the world as we perceive it” (14). We often associate ourselves with where we are from and where we have been. Locations has always been an important of our lives. Being able to see Linn’s experience in terms of location and path, we are able to integrate more information than we could with other kind of representations. With the help of GIS, we can display the location, time, and context of these events.
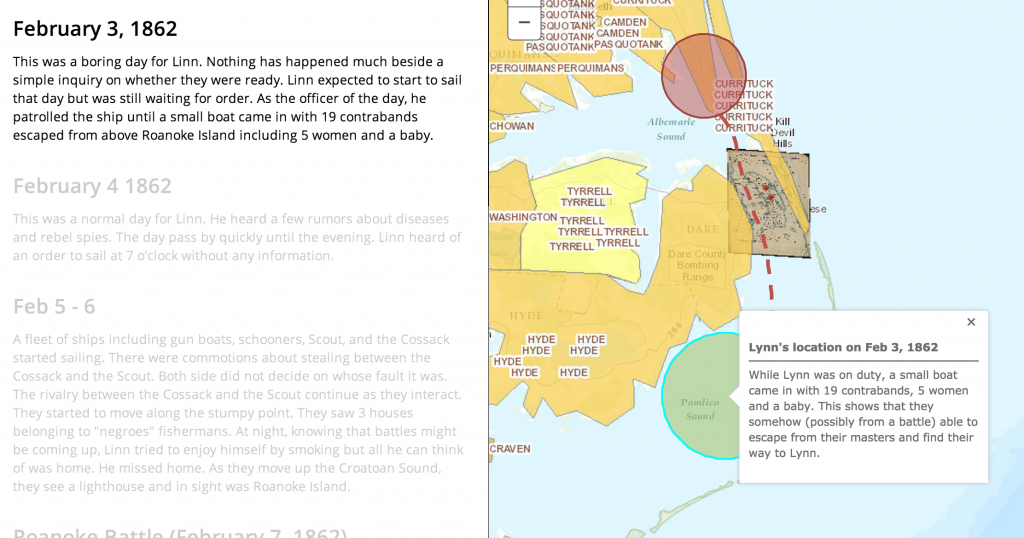
In my experience with GIS, using a layer for the concentration of slaves in the United States in the 1860s and the battle won by the North, I was able to estimate the location for the 19 contrabands’ origin. In the diary, Linn says “a small boat came in, said to have had on board 19 contrabands, who escaped from above Roanoke — 5 women & a baby”. From seeing the concentration of battles won by the North close to Roanoke, we are able to see its correlation with the escape of the slave.
“Evidence about the world depends on the perspective of the observer” (19). In the diary, Linn mentioned that the gun boats went between Tyrrell Shore and Roanoke Island. As we can clearly see, Tyrrell is the slave concentration area which is far from Roanoke Island. Without the help of GIS, we would not have question Linn’s directional sense. This ,however, can also means that the maps they had back then was not accurate. The answer to this is not important but what important is the question itself. Without GIS, we would never have come up with this hypothesis and therefore another piece of information.
Bodenhamer says “visualize a spatially accurate physical and manmade environment that proved the attraction” (21). We were able to walk in Linn’s shoes. He noticed sightsee, he observed the shore and the lighthouse, He had a smoke at night. Seeing how close he was to the battle, we can have a close reading on his personal life.
Humans often think in terms of space: where things are, how far apart, in what direction. When examining a story, whether it be real or fictional, mapping out a spatial representation of the events can be a powerful tool in understanding deeper meanings and reasons. As Bodenhammer explains it, “space offers a way to understand fundamentally how we order our world” (14).
Many of the decisions we make every day are greatly dependent on how we examine the space around us. This was no different for people living 100 or 1000 years ago. When we look at historical recordings, the reasoning behind many actions can be lost or go unseen, simply because we can’t see what they saw. However, using GIS mapping, historical maps, and other visual tools, we can recreate, to some extent, the world that these historical figures lived in. By examining these maps and other visuals, we gain a better understanding of the circumstances and influences that led people to decide on the actions they took. Bodenhammer mentions the example of the discovery of the New World (14-15). It’s hard for us to imagine the allure of this land to the European countries 500 years ago because we know this place as our home. However, historical maps and paths of the journeys of explorers let us see the vast open expanse that existed here. Combine that with maps of population growth and religious turmoil in Spain, France, and England, and we can start to see the circumstances that led to the era of colonization.
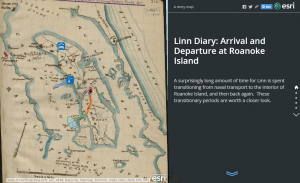
Working in this way with Linn’s diary led to many interesting revelations. The GIS mapping I did of his arrival to and departure from Roanoke island revealed a number of things about his experiences. For instance, in his diary entry on February 7th, he mentions having to walk through a swamp to reach the rest of the regiment after making shore on the island. With Linn’s short description, it was impossible to determine just how long he spent traversing these wetlands. However, by drawing the path between the landing point and the regiment using GIS, I was able to see that most of that 2 mile journey was through swamp. Once arriving at camp, Linn seems in a rather negative mood. The difficulty that this march must have presented would explain his feelings at the time.
Bodenhammer describes a potential use of GIS technology as creating a myriad of different layers on a map, where each one “would contain the unique view over time – the dynamic memory – of an individual or a social unit” (27-28). I think it would be very interesting to see what we could make of journal entries of different people with connections to Linn. The personal stories of Beaver or General Reno could provide us with more insight into the things Linn didn’t write down, how these people were connected, and where their paths crossed and diverged.
In the past couple of weeks we have worked thoroughly with GIS. This has taught me a great deal about the digital world and how to convey it to the general public. For example, we learned how to create maps that represented the travels of Linn throughout his diary. With GIS, we are able to map Linn’s positions and see what he saw through different map layers. In my case, I used the map layer “RoanokeRebels” to plot Linn’s journey from the beaches of Reno all the way to Pork Point. I was able to visualize the various forts and land obstacles, as well as get a feel for the exact route Linn took to get to his destination. GIS creates a story out of just a few of Linn’s diary entries. This idea of mapping through GIS relates directly with Bodenhammer’s theory of spatial thinking.
Linn and his comrades run into fellow soldiers in a swamp and stop to talk about past colleges, friends, etc.
Spatial thinking is the way in which we navigate the world while manipulating the space around us. It is this type of thinking that has, “reinvigorated geography as a discipline, just as it has engaged scholars within humanities” (Bodenhammer, 14). More specifically, it has brought about what Bodenhammer calls “intellectual currents” into the American experience. GIS is a perfect example of how maps can provide a story in which anyone can follow. At the beginning of this assignment, I knew nothing about Roanoke Island and what battles had taken place there. However, through the process of mapping and what Bodenhammer calls, “observation and testing”, I have been able to develop a good understanding as to how the battle of Roanoke Island unfolded.
It doesn’t matter what the map is of or where it is, through spatial thinking with the right resources, we are able to comprehend any event in history. What’s so great about GIS is that it offers, “a view of the physical environment seemingly stripped of its cultural assumptions” (Bodenhammer, 16). This means that we are seeing the map as a plain canvas into which unlimited amounts of data are poured into it. Through the addition of map layers and map notes, the viewer is able digest what happened on that particular map, and can then proceed to make an inference on what occurred. Despite all these benefits of GIS, “most humanists have not adopted GIS, or more fundamentally, found it helpful” (Bodenhammer, 22). However, I believe that over time, people will start to realize the value of GIS and will learn to incorporate it more and more into their work.
Here is the link to my map project: http://bit.ly/1qv35c8

 “Evidence about the world depends on the perspective of the observer” (19). In the diary, Linn mentioned that the gun boats went between Tyrrell Shore and Roanoke Island. As we can clearly see, Tyrrell is the slave concentration area which is far from Roanoke Island. Without the help of GIS, we would not have question Linn’s directional sense. This ,however, can also means that the maps they had back then was not accurate. The answer to this is not important but what important is the question itself. Without GIS, we would never have come up with this hypothesis and therefore another piece of information.